ds_grid_draw

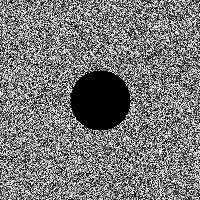
This script will draw the contents of a grid data structure which is populated by numerical data. It performs a normalization process so that the entire range of values within the grid are drawn from black to white.
While the script is very simple and lacks options, it can be especially useful for development and debugging purposes.
- ds_grid_draw(grid,x,y)
- Draws the data of a given grid at a screen location.
COPY/// ds_grid_draw(grid,x,y)
//
//  Draws the data of a given grid at a screen location.
//
//      grid        grid data structure, id
//      x,y         screen position, real
//
/// GMLscripts.com/license
{
    var grid = argument0;
    var sx = argument1;
    var sy = argument2;

    var w = ds_grid_width(grid);
    var h = ds_grid_height(grid);

    var M = ds_grid_get_max(grid,0,0,w-1,h-1);
    var m = ds_grid_get_min(grid,0,0,w-1,h-1);
    if (M == m) var f = 0 else var f = 1/(M-m);

    for (var i=0; i<w; i++)
    {
        for (var j=0; j<h; j++)
        {
            var value = f*(ds_grid_get(grid,i,j)-m);
            draw_point_color(sx+i,sy+j,make_color_hsv(0,0,clamp(255*value,0,255)));
        }
    }

    return 0;
}
Contributors: xot
GitHub: View · Commits · Blame · Raw

